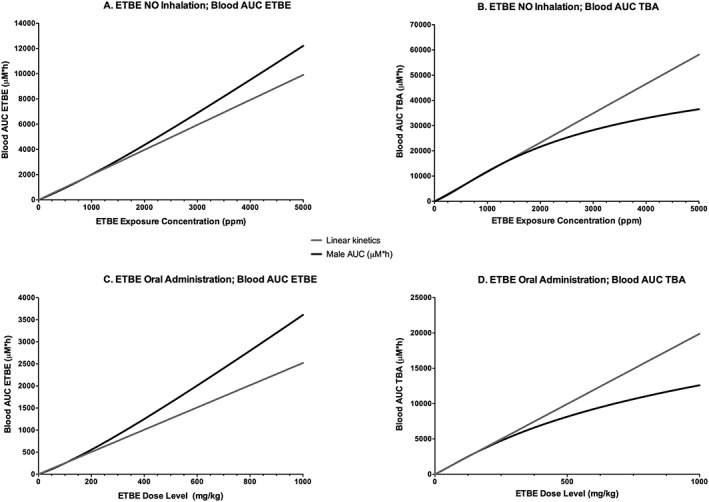
Figure 11.

Model simulations of ETBE (A,C) or TBA (B,D) blood AUC following inhalation exposure of a male rat at concentrations up to 5000 ppm, or oral gavage administration up to 1000 mg kg−1 bw, to demonstrate the exposure concentration in which kinetics shifts from linear to nonlinear. ETBE, ethyl tertiary‐butyl ether; TBA, tertiary‐butyl alcohol.
