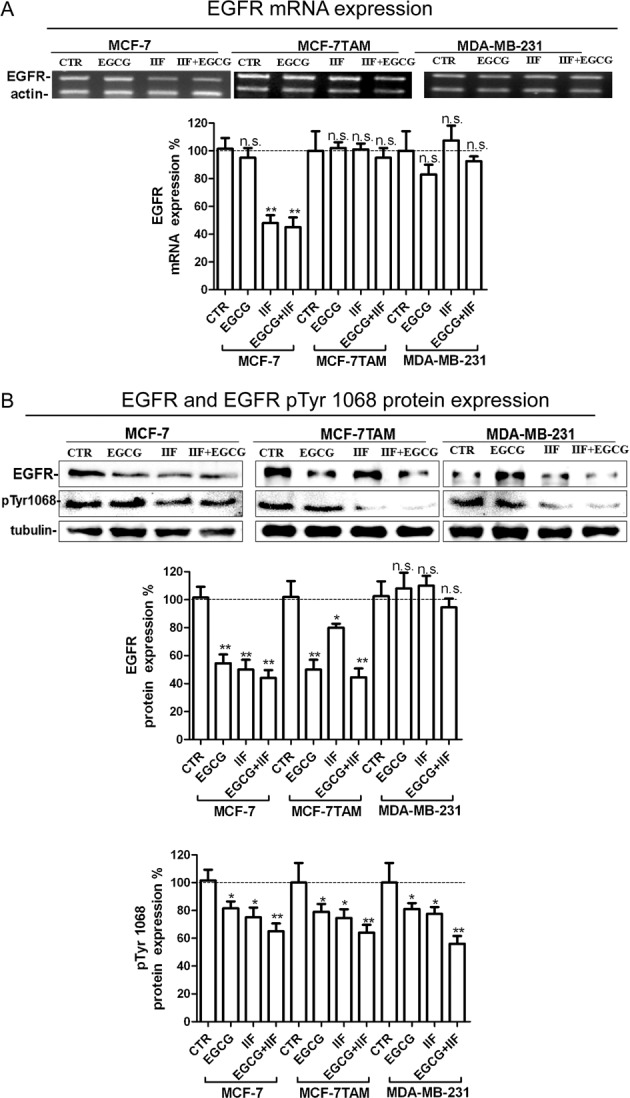
Figure 1. EGFR receptor expression in MCF-7, MCF-7TAM and MDA-MB-231 cells.

(A) RT-PCR for EGFR and β-actin (internal standard). RNA was isolated after 24 h treatments at the following concentrations: EGCG 25 μg/mL, IIF 15 μM in MCF-7 cells or 30 μM in MCF-7TAM and MDA-MB-231 cells and combined treatments EGCG + IIF at the aforementioned concentrations. EGFR mRNA expression was expressed as percentage of treated on control samples (CTR). Each bar represents the mean (± S.D.) of three independent experiments. n.s., not significant. *P<0.05; **P<0.01. (B) Western blot for EGFR and p1068EGFR: proteins were isolated after 24-h treatments at the following concentrations: EGCG 25 μg/mL, IIF 15 μM in MCF-7 cells or 30 μM in MCF-7TAM and MDA-MB-231 cells and combined treatments of EGCG + IIF at the aforementioned concentrations. EGFR protein expression was expressed as percentage of treated on control samples (CTR). γ-tubulin was used as an internal standard. Each bar represents the mean (± S.D.) of three independent experiments. n.s., not significant. *P<0.05; **P<0.01.
