
Figure 3.
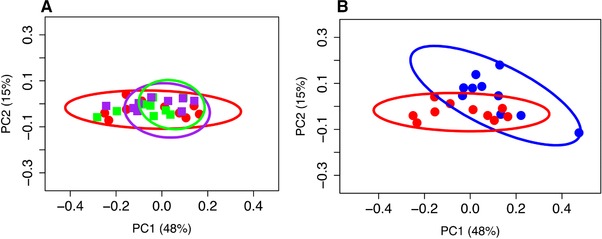
(a) Principal coordinates analysis using weighted UniFrac distance on 16S sequences from fecal microbiota of sham (blue) and OVX (red) rats showing there are distinct phylogenetic differences in the gut microbiome between sham and OVX rats (Adonis, R 2 = 0.17, p = 0.017); (b) Principal coordinates analysis using weighted UniFrac distance on 16S sequences from fecal microbiota of OVX (red), low (purple) and high (green) dose nitrate treated rats shows no distinct phylogenetic differences in the gut microbiome between OVX controls and OVX rats supplemented with nitrate. These results are consistent at the taxonomic level. Points represent individual rats. Ellipses represent 95% confidence intervals.