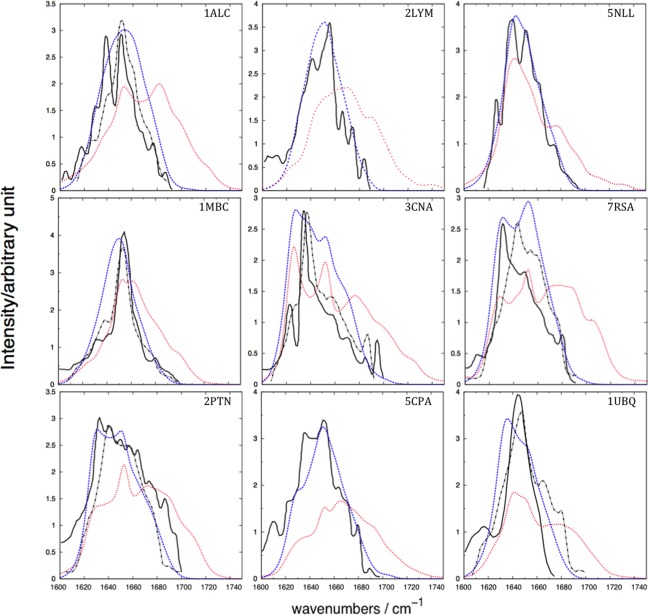
Figure 2.

Amide I IR spectra of the nine proteins. The solid black line represents the experimental spectra from various sources cited by Torii and Tasumi, J. Chem. Phys., 1992, 96, 3379, reproduced by permission,42 who reported that the spectra were “weakly deconvoluted”. The dashed black represents the experimental (recorded for 3% protein solution in H2O) transmission IR spectra taken from Karjalainen et al., J. Phys. Chem. B, 2012, 116, 4831, reproduced by permission.54 The dashed blue represents the average computed spectra including solvent, and the dotted red line represents the average computed spectra excluding solvent. See Table 2 for the names of the proteins. [Color figure can be viewed at wileyonlinelibrary.com]
