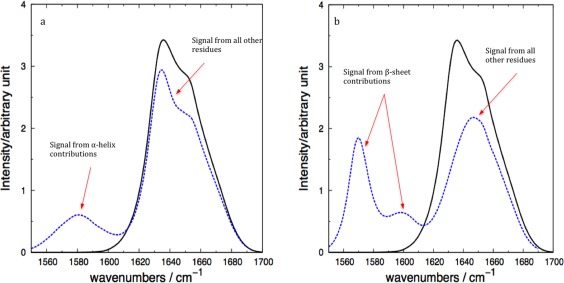
Figure 5.

Computed 1D spectra of ubiquitin (1UBQ) with 13C18O isotope labeling of the α‐helix residues a), and β‐sheet residues b). The solid black line in both panels represents the unlabeled computed spectrum, while the dashed blue line represents the isotope labeling cases. [Color figure can be viewed at wileyonlinelibrary.com]
