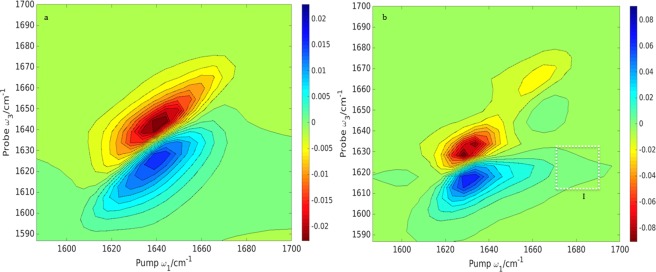
Figure 10.

Computed 2D absorptive spectra using the ZZZZ scheme of α a) and β b) secondary structure separately of ubiquitin (1UBQ). The contours are plotted with a 10% intensity of the maximum amplitude and 20 uniformly spread contours from the minimum to the maximum intensity for the left panel and 20 similar uniformly spread contours for the right panel. Cross‐peaks are highlighted with white dotted squares. [Color figure can be viewed at wileyonlinelibrary.com]
