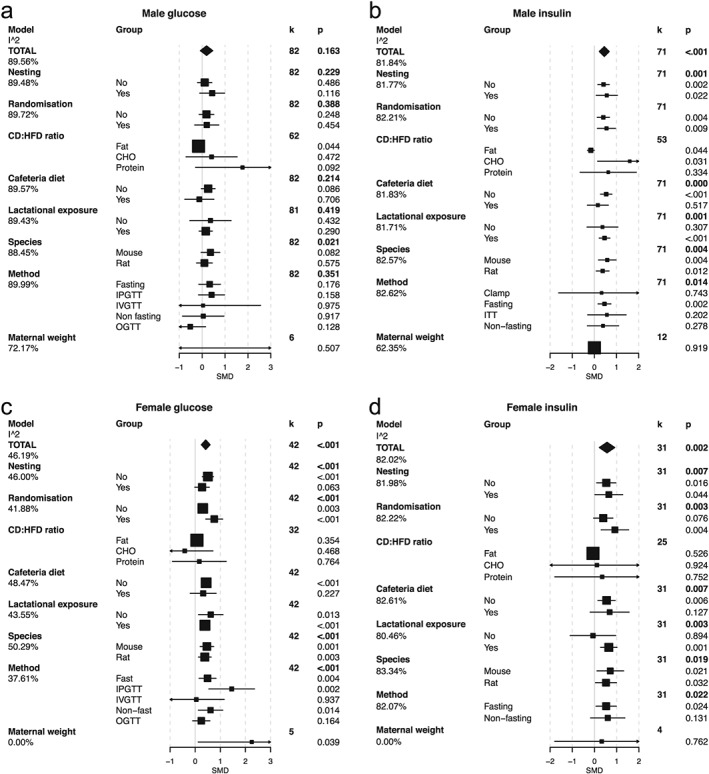
Figure 3.

Meta‐analysis and meta‐regression of glucose homeostasis in the male and female offspring of mothers exposed to a high fat diet (HFD) during gestation and lactation. a. Male glucose, b. male insulin, c. female glucose, d. female insulin. In the TOTAL model, estimated standardized mean differences (SMD) and 95% confidence intervals are presented as a summary of all studies. k refers to the number of studies included. The significance of the effect size was assessed by random‐effects model analysis. Intra study heterogeneity (as a percentage) is shown as the I^2 value. Explanation for heterogeneity was explored by meta‐regression by including various moderating factors into the random‐effects model. These included the following: nesting – the use of statistical procedures to account for non‐independence of animals from the same litter; randomization – the random assignment of animals to each intervention group; CD:HFD ratio of macronutrients, fat, carbohydrate (CHO) and protein; cafeteria diet – the use of choice diet or supplementation of standard diets with palatable energy‐rich foods; species; the method by which glucose–insulin homeostasis was assessed; and maternal weight – an approximation for gestation weight gain taken as the ratio change in weight from pre mating to post lactation. Estimates for the SMD and 95% confidence intervals are presented for these models along with the residual heterogeneity unaccounted for in the model (the I^2 beneath each model).
