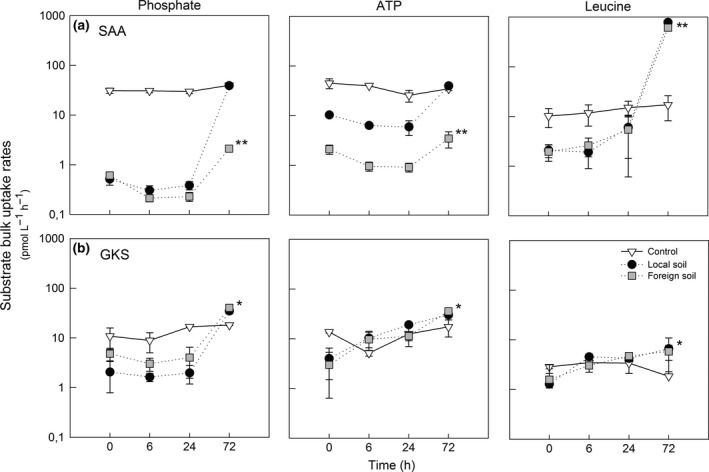
Figure 4.

Phosphate, ATP and leucine bulk uptake rates assessed during the experiments. Different symbols indicate the control and the two treatments in lakes (a) SAA and (b) GKS. Data points represent the mean of triplicate incubations, and error bars represent ± 1 SD which are in some cases smaller than the symbol. Asterisks indicate significant difference (Tukey, *P < 0.01, **P < 0.001) in substrate bulk uptake rates between the control and the soil treatments at the end of the experiments. Note that the y‐axis is in logarithmic scale.
