Figure 6.

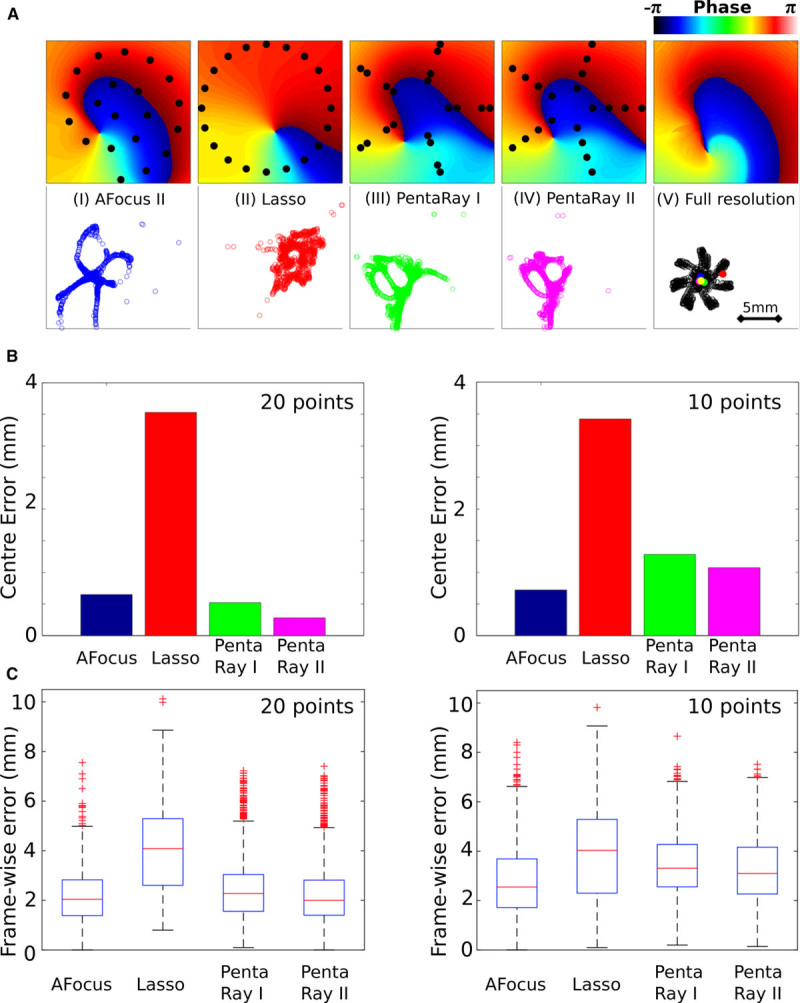
Multipolar catheters are of sufficient resolution to accurately detect and track rotors. A, Top: Example isophase maps interpolated from the recording points shown in black (I–IV), with the phase from the full-resolution simulation data shown in (V). Bottom: Rotor core phase singularity (PS) trajectories for each catheter type calculated using the interpolated phase. Examples are shown for spiral (AFocus II), circular (Lasso), and 2 five-spline electrode arrangements (PentaRay I and PentaRay II). B, Errors in the time-averaged estimated center location compared with the time-averaged location computed from the raw simulation data. Catheters are configured as either 20 unipoles or 10 bipoles. C, Box plots to show frame-wise difference in estimated PS location compared with the location computed from raw simulation data. The boxes indicate the interquartile range (IQR) and median (red line) of the data; the whiskers extend to a maximum of 1.5×IQR; and the crosses represent outliers.
