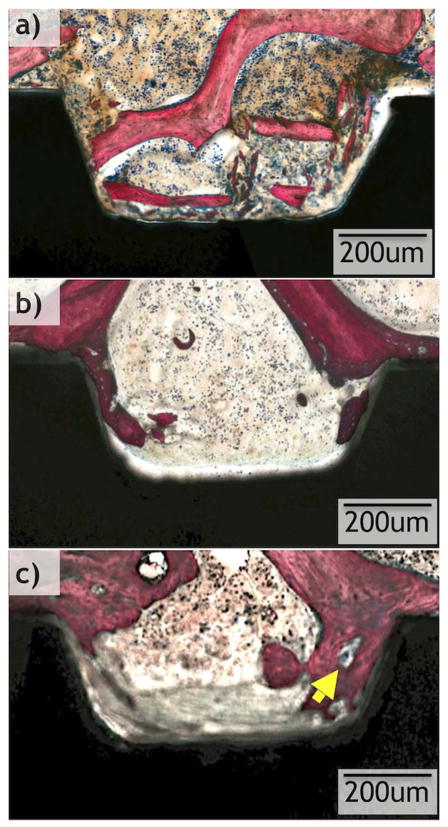
Fig. 8.
Higher magnification optical micrographs taken from samples at each time point (0, 3, and 6 weeks) from the regular drilling group. Yellow arrows show remodeling sites. (For interpretation of the references to color in this figure legend, the reader is referred to the web version of this article.)

