
Fig. 11.
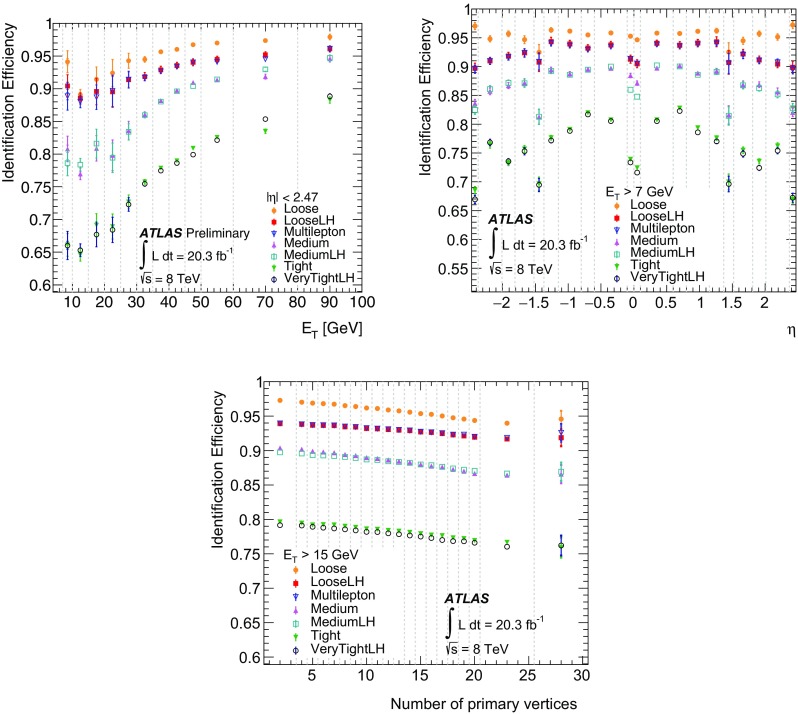
Measured identification efficiency for the various cut-based and LH selections as a function of (top left), (top right) and the number of reconstructed primary vertices (bottom). The data efficiency is derived from the measured data-to-MC efficiency ratios and the prediction of the MC simulation from decays. The uncertainties are statistical (inner error bars) and statistical + systematic (outer error bars). The last bin in and number of primary vertices includes the overflow. The dashed lines indicate the bins in which the efficiencies are calculated