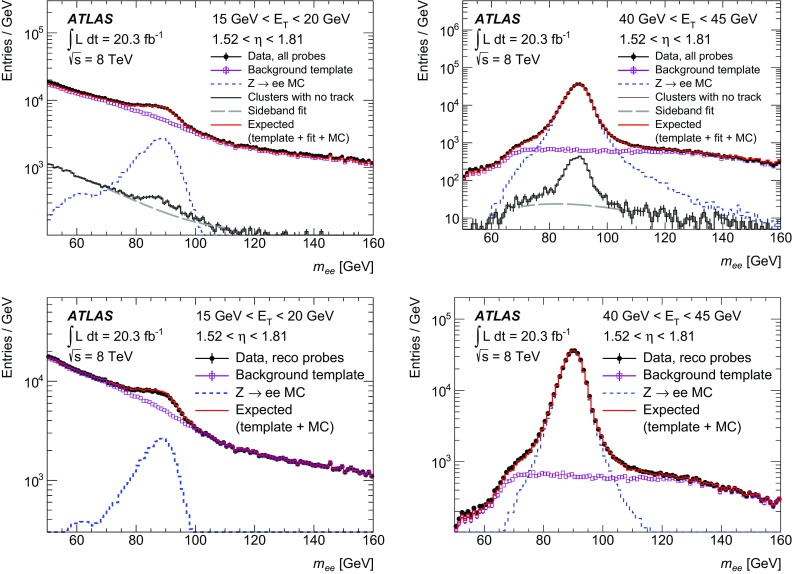
Fig. 19.

Invariant-mass distributions of the tag-and-probe pairs for probe EM clusters with 1.52 < < 1.81 and 15 (left) or 40 (right), before (top) and after (bottom) applying the reconstruction criteria. The data (black dots with error bars) at the all probes level is composed of two components: clusters with no matching track (dark grey histogram with error bars) and clusters with a matching track. The background is evaluated separately for these two components. A third-order polynomial (grey dashed line spanning the region from 70 to 110 ) depicts the estimated photon background from a fit performed in the sideband regions as explained in Sect. 10.1.2 and shown in Fig. 18. A background template normalized in this case to the high-mass tail (magenta markers) is used to estimate the background with a matching track. This background template is obtained by requiring some of the identification criteria not to be satisfied. Additionally, probes must pass or fail the track quality selection requirements depending on whether the background to the electrons passing or failing the reconstruction requirements is determined (see Sect. 10.1.2). The shown magenta distribution is the sum of both components. For illustration only, the signal prediction of the MC simulation (blue dashed line) is also displayed. The sum of the normalized background template and the signal prediction of the MC simulation (red line, shown for comparison but not used in the measurement) agrees well with the data points
