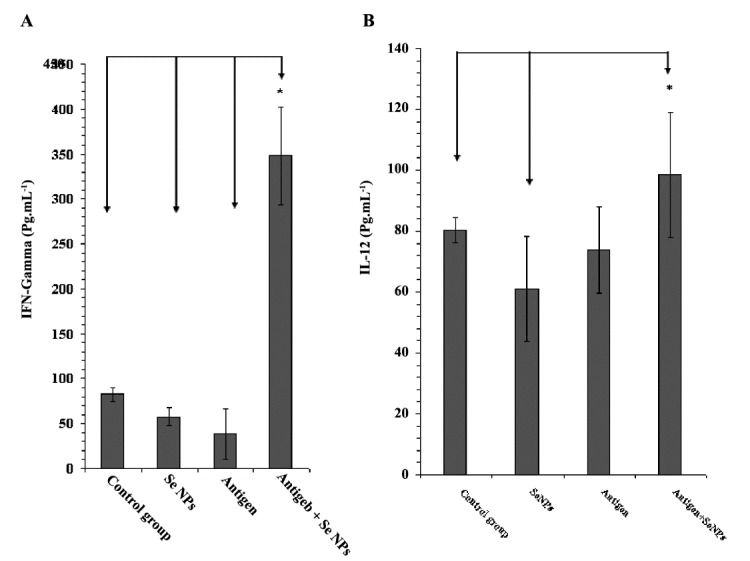
Figure 4 .

A: The levels of IFN-γ and B: IL-12 in serum samples of different mouse groups, determined by sandwich ELISA after 30 days. Data represent the mean ± standard deviation of eight animals per group. Significant differences were observed between group 4 and all other groups in IFN-γ (A) and between group 4 with 1 and 2 in IL-12 (B) as arrows shows *(P < 0.05)
