
Figure 1 .
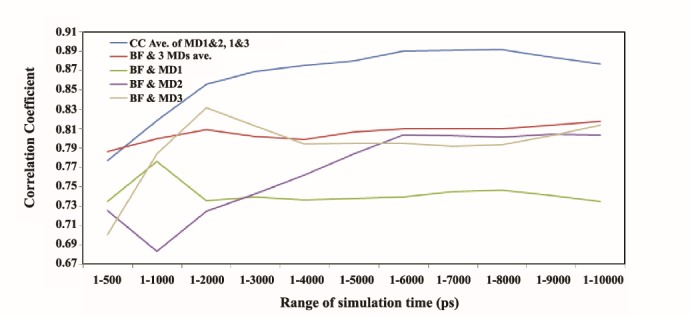
Correlation Coefficient (CC) between Cα-MD-RMSFs among themselves and with crystallographic Cα-B-factor (BF) of hCDK2 during 10 ns time scale of the MD simulations. Blue curve depicts the plot for the average CC between Cα-RMSFs of MD1 and 2, 1 and 3, and 2 and 3 during 10 ns of the MD trajectories time scale. The red curve is for CC between the average of three Cα-RMSFs and Cα-B-factor during the same time for the MD trajectories. The green curve shows the CC plot between Cα-B-factor and Cα-RMSF of the MD1. Purple curve depicts CC between Cα-B-factor and Cα-RMSF of the MD2 the gray curve indicates CC between Cα-B-factor and Cα-RMSF of the MD3