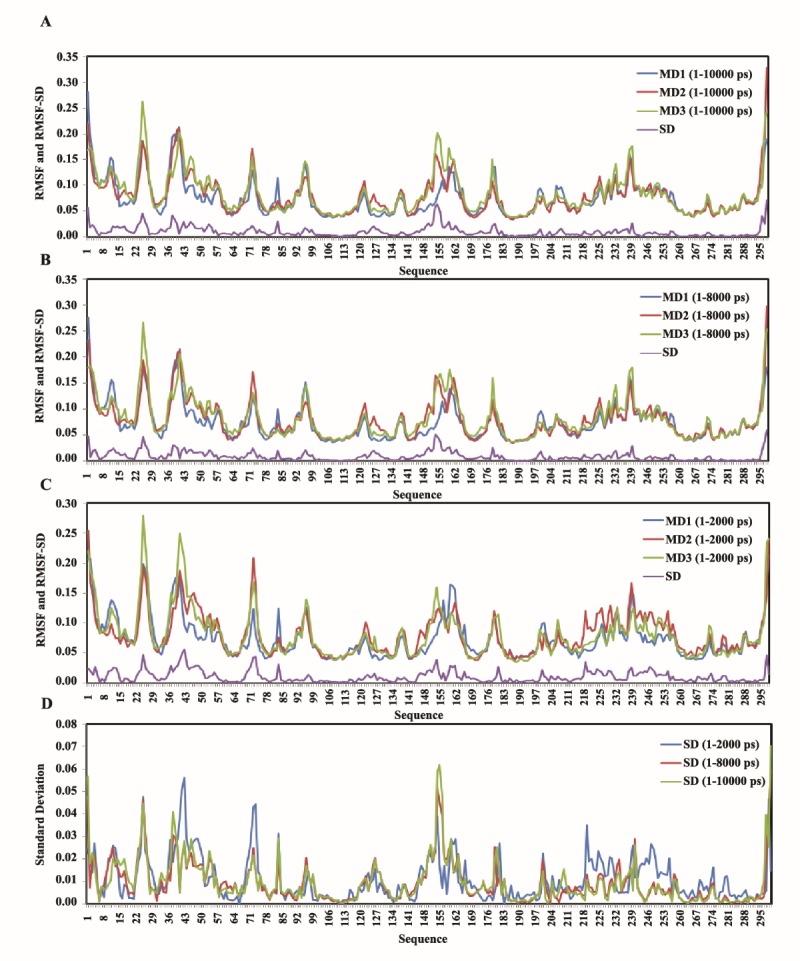
Figure 3 .

RMSF and RMSF-SDs of 1-2000, 1-8000 and 1-10000 ps time scale of the three independent MD trajectories; A: depicts the curves for 1-10000 ps, B: for 1-8000 ps, C: for 1-2000 ps, and D: is RMSF-SDs for the three MD trajectories in 1-10000, 1-8000 and 1-2000 ps time scale
