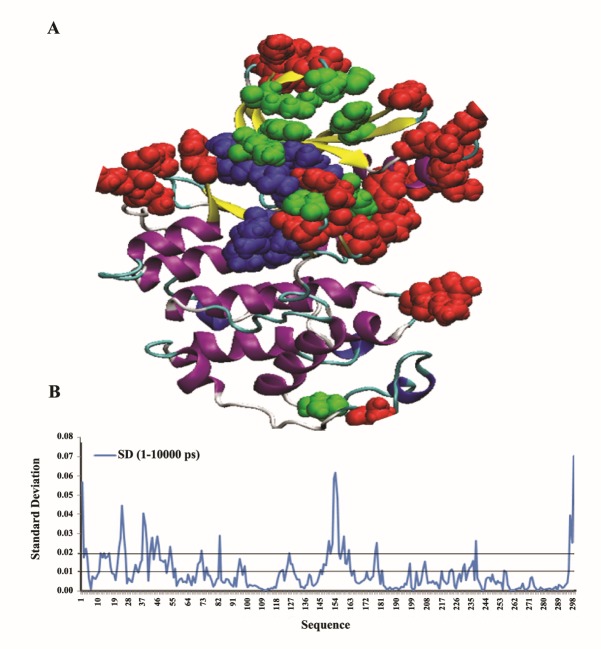
Figure 4 .
The first form of clustering variable and non-variable regions in RMSF plot of the hCDK2 within three independent MD trajectories. A: Residues with red CPK model compose those residues with a high RMSF-SD more than 0.02. Residues with blue color in CPK model are nucleotide-binding regions of hCDK2 and the green ones are the other functional regions such as regions which undergo modifications and a number of other binding sites. B: Illustrates RMSF-SD plot for RMSFs of three independent MD trajectories at 1-10000 ps time scale

