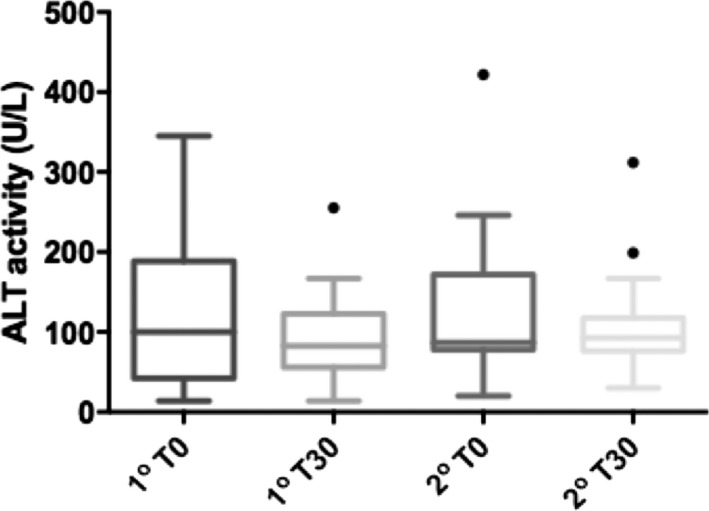
Figure 5.

Box‐and‐whiskers graph of serum ALT activity before (T0) and 30 days after (T30) therapy with Bezafibrate in 15 dogs with primary hyperlipidemia (1o) and 31 dogs with secondary hyperlipidemia (2o). Boxes represent 25th and 75th percentiles with median in between. The whiskers represent values at 1.5× IQR (interquartile range) and the individual points represent outliers.
