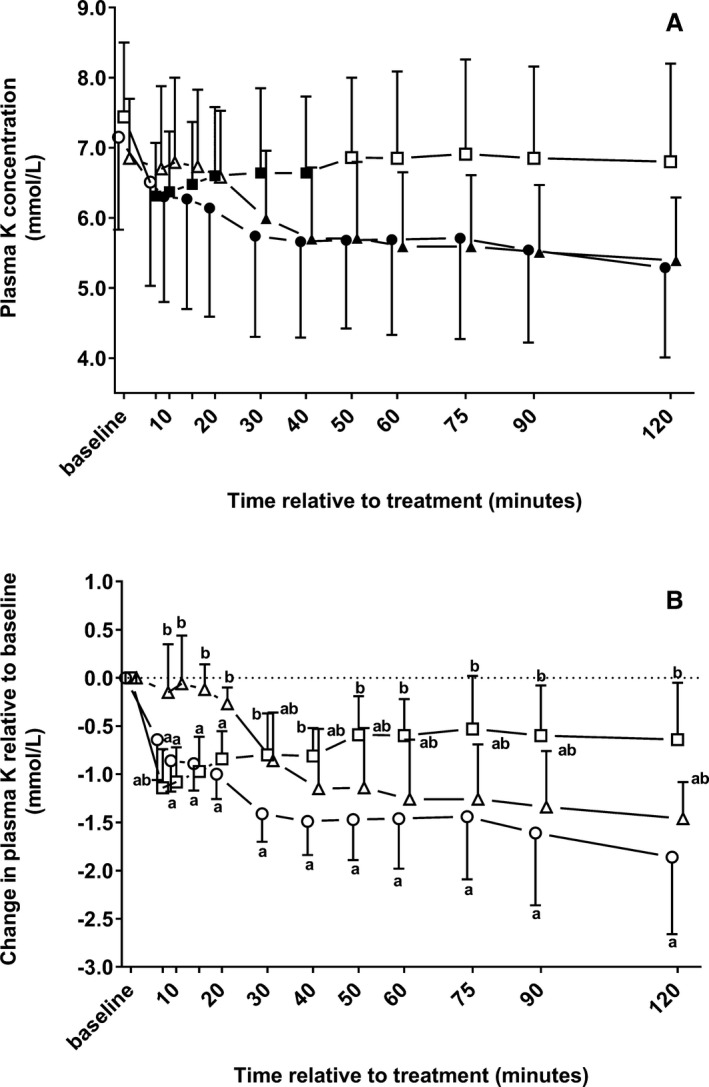
Figure 1.

Mean ± SD of plasma potassium concentrations (A) and changes in plasma potassium concentrations relative to baseline (B) in 22 neonatal diarrheic calves after injections of an 8.4% sodium bicarbonate solution in a dosage of 6.4 mL/kg body mass (ο; n = 7), 7.5% sodium chloride solution in a dosage of 5 mL/kg body mass (□; n = 8), or a 46.2% glucose solution in a dosage of 5 mL/kg body mass (Δ; n = 7) over a period of five min and subsequent administration of an oral electrolyte solution. Values with different letters differed significantly between groups (P < .05). Values with a filled symbol in graph A differ significantly (P < .05) from baseline (within‐group comparisons for the change in plasma potassium concentrations relative to baseline were not possible due to the statistical methods applied). Values for groups NaBic and Gluc were slightly offset at each time point to improve readability.
