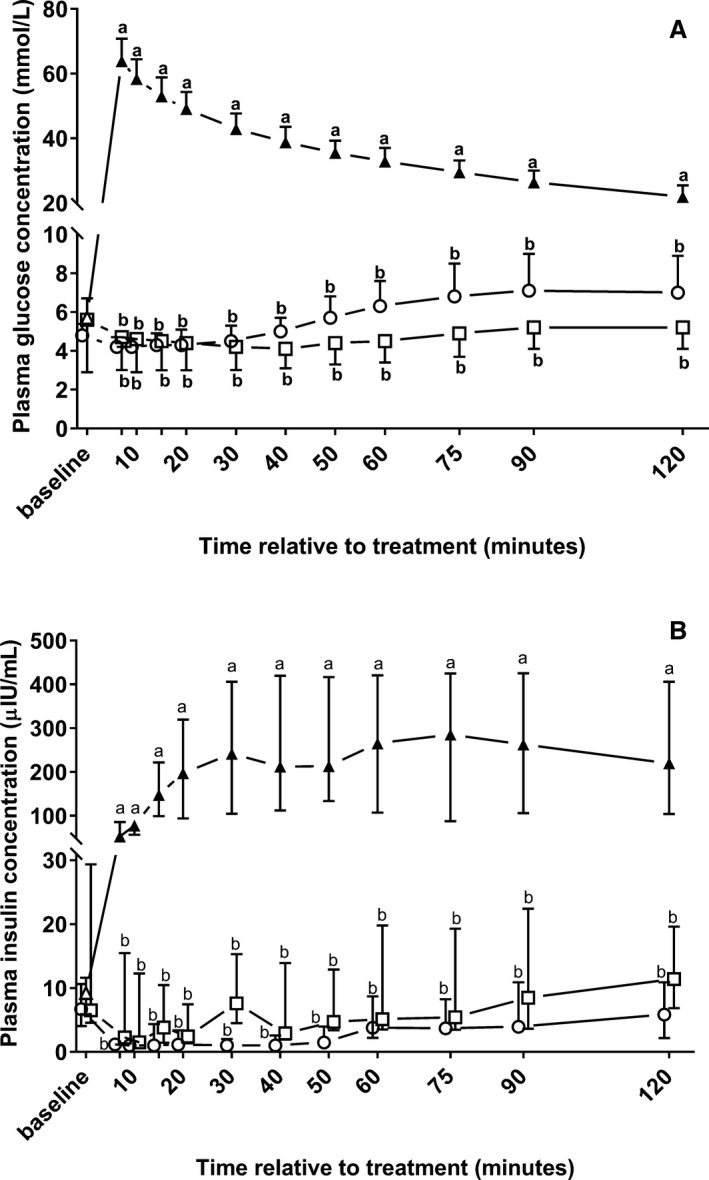
Figure 5.

Changes in plasma glucose (A; mean ± SD) and insulin (B; median and interquartile ranges) concentrations in 22 neonatal diarrheic calves after injections of an 8.4% sodium bicarbonate solution in a dosage of 6.4 mL/kg body mass (ο; n = 7), 7.5% sodium chloride solution in a dosage of 5 mL/kg body mass (□; n = 8), or a 46.2% glucose solution in a dosage of 5 mL/kg body mass (Δ; n = 7) over a period of five min and subsequent administration of an oral electrolyte solution. Values with different letters differed significantly between groups (P < .05). Values with a filled symbol differ significantly from baseline (P < .05). Values for groups NaBic and NaCl were slightly offset at each time point to improve readability.
