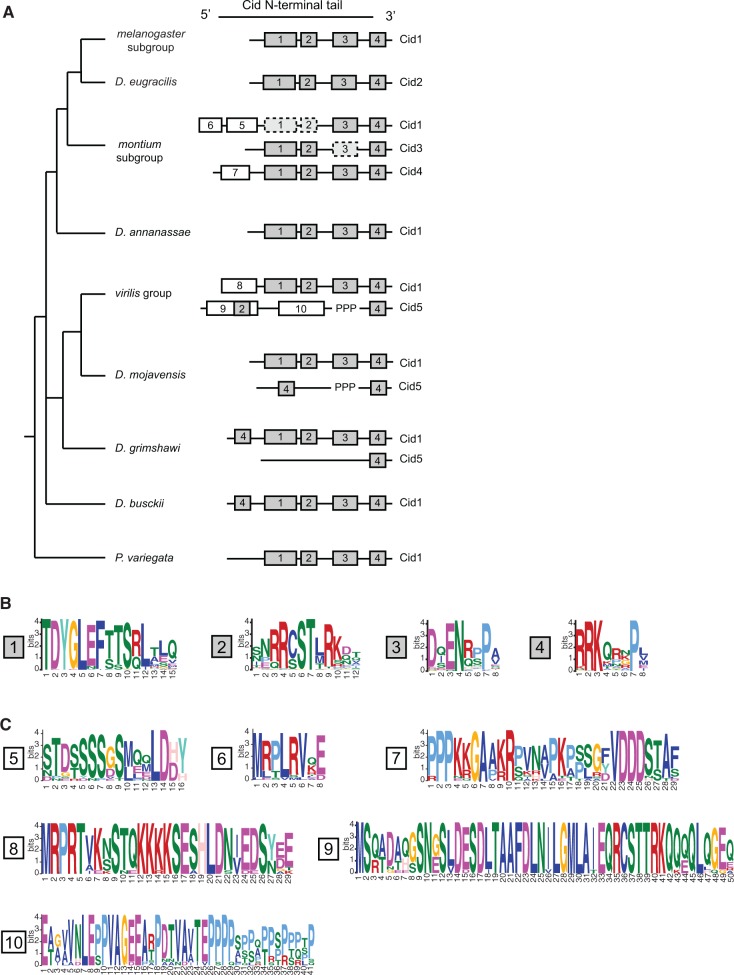
Fig. 6.
Evolution of N-terminal motifs among all Cid proteins. (A) A Drosophila species tree with a schematic of N-terminal tail motifs identified by MEME and MAST displayed to right of each species or species group. Each number represents a unique motif that does not statistically match any other motif in the figure with the exception of motif 2 and 9 (see Materials and Methods). Gray boxes indicate “core” motifs 1–4, which are present in all single copy Cid genes. White boxes indicate lineage specific motifs. “PPP” indicates the position of the variable proline-rich region in Cid5. Dashed boxes indicate cases in which a given motif was present in ∼50% of species. (B) Logos generated by MEME for consensus motifs 1–4. (C) Logos generated by MEME for consensus motifs 5–10.

