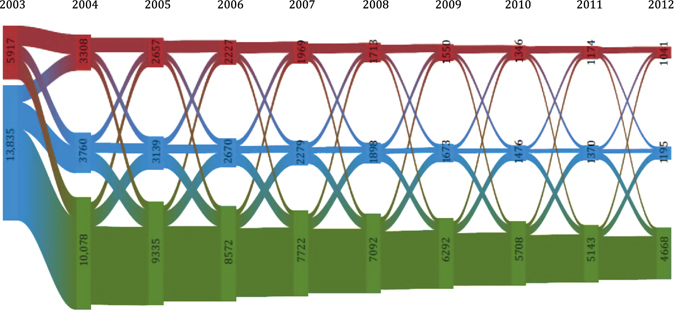
Fig. 2.

The stability at a population level over time. Riverplot illustrating the stability of the exacerbation rate over time among exacerbators at baseline. The size of the nodes is proportional to the percentage of individuals classified as frequent exacerbators, infrequent exacerbators and non-exacerbators, respectively. The thickness of the links between categories illustrates the size of the flow, i.e., the proportion of COPD patients within each category who are classified as either frequent exacerbators, infrequent exacerbators and non-exacerbators in the following year. The difference in volume between links and nodes represents the number of deaths each year. Red Frequent exacerbators (≥2 exacerbations in the given year); Blue Infrequent exacerbators (1 exacerbation in the given year); Green Non-exacerbators (0 exacerbations in the given year)
