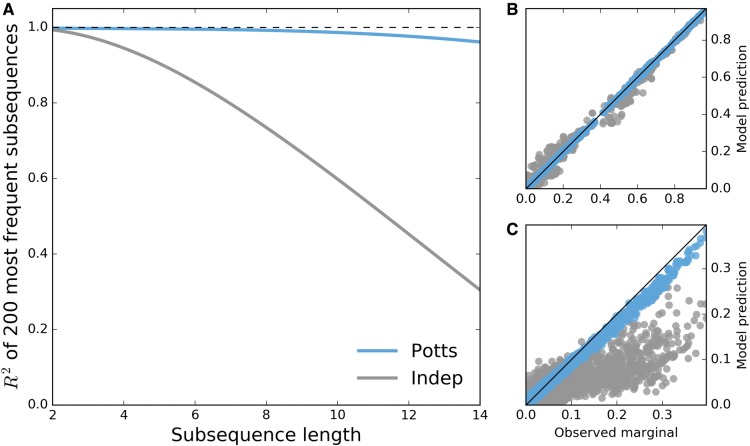
Fig. 1.
Potts model is predictive of higher order sequence statistics. For each subsequence length varying from 2 to 14, subsequence frequencies determined by counting occurrences in the MSA are computed for all observed subsequences at 500 randomly chosen combinations among 36 PI-associated positions. (A) Pearson R2 of the 200 most probable observed subsequence frequencies (marginals) with corresponding predictions by Potts (blue) and independent (gray) models for varying subsequence lengths. The dashed line represents perfect correlation . (B) Second and (C) 14th order observed marginals predicted by both models. Shown in (B,C) are observed frequencies at the 500 randomly chosen combinations of 2 and 14 positions among 36 PI-associated sites, with ∼2500 and 5600 subsequence frequencies >0.01 visible, respectively.

