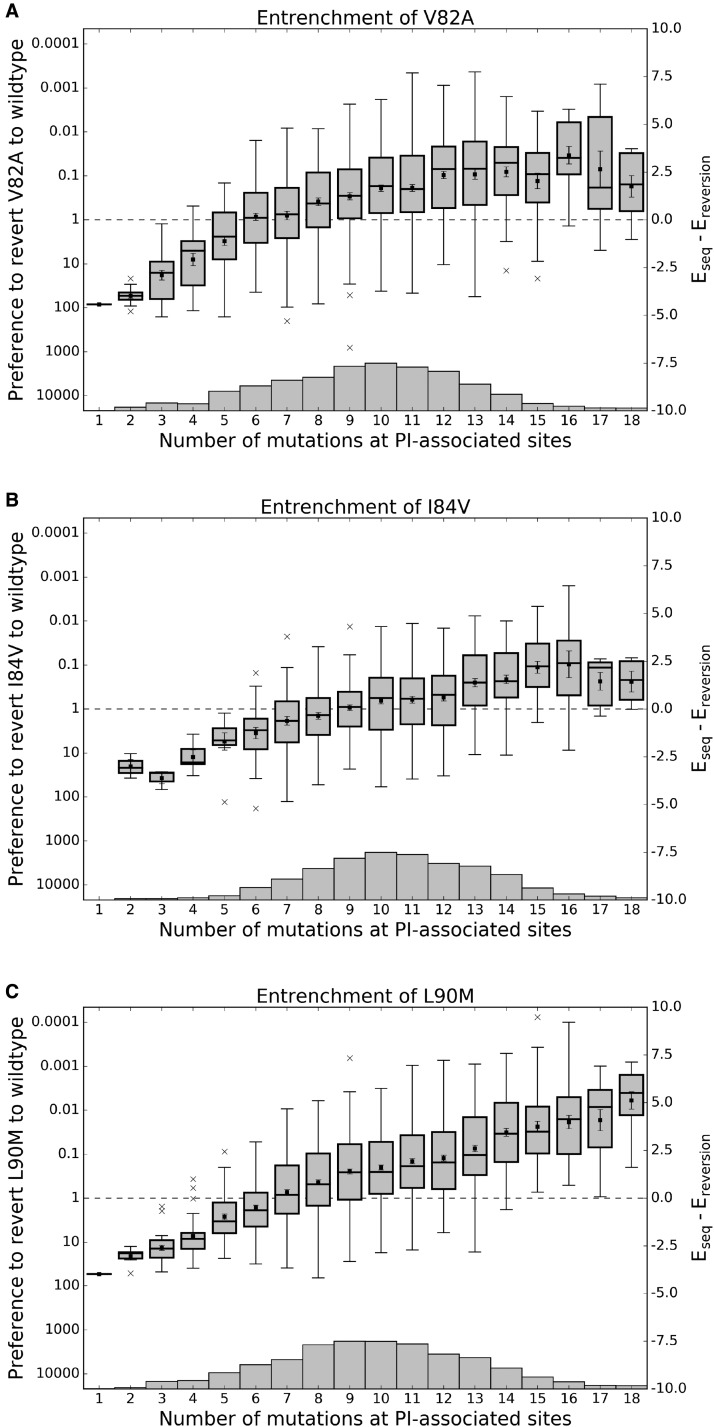
Fig. 4.
Effect of epistasis on the fitness penalty incurred by primary resistance mutations. For each of the three primary HIV protease mutations described in Chang and Torbett (2011), two Potts statistical energies are computed for all observed sequences containing that mutation: Eseq, the energy of the sequence with that mutation and Ereversion, the energy with that primary mutation reverted to wildtype. This Potts energy difference, is shown versus Hamming distance from the wildtype including only PI-associated positions. Ordinate scales are given in both relative probability of reversion (left) and (right). Energy differences corresponding to sequences with the same Hamming distance from wildtype are displayed as a boxplot, with mean values marked as squares, first, second, and third quartiles shown as horizontal lines forming the boxes, and whiskers extend 1.5 times the interquartile range or to the most extreme values if they lie within this range. Outlier energy differences are shown as “x”s. Box sample sizes are shown as a histogram along the horizontal axes with minima/maxima 1/161, 2/103, and 1/202 for V82A, I84V, and L90M, respectively. Energy differences below (above) the dashed line on the ordinate correspond to fitness gain (penalty) upon reversion to wildtype. Although primary resistance mutations initially destabilize the protease, as mutations accumulate, the primary resistance mutations become entrenched, meaning their reversion becomes destabilizing to the protein.

