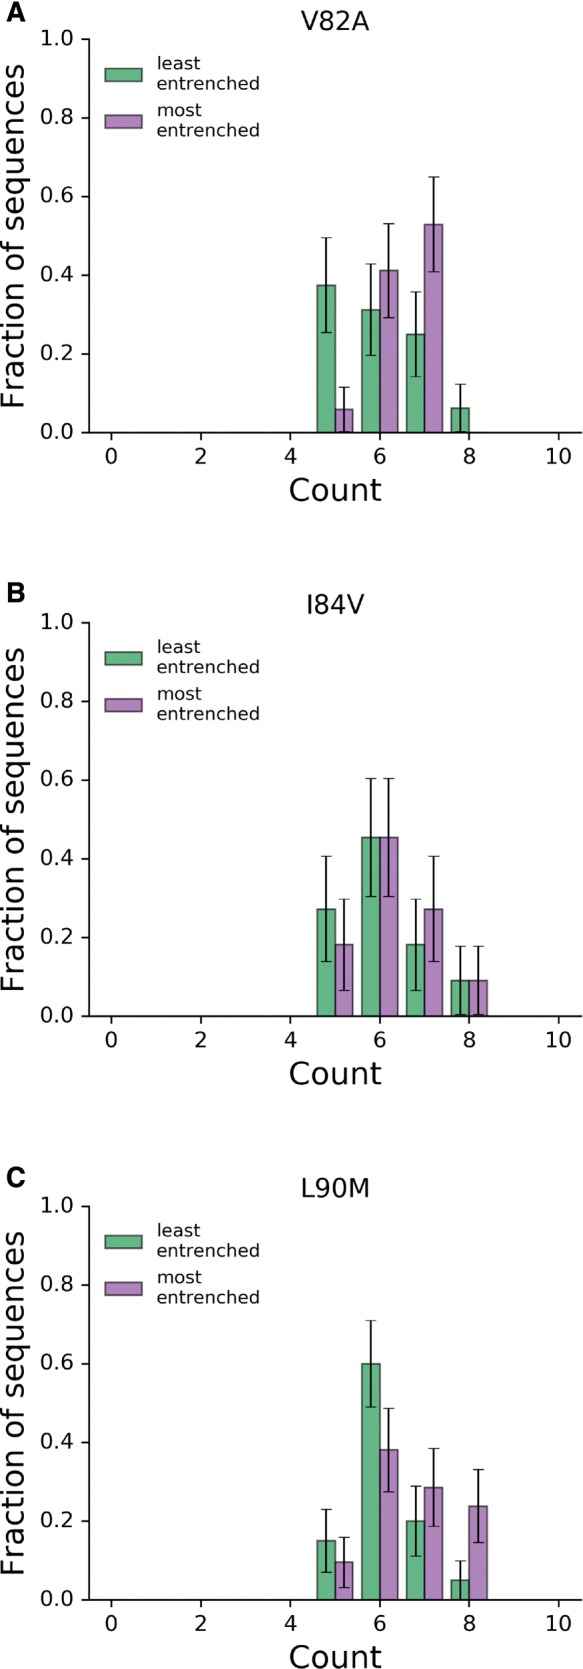
Fig. 5.

Distributions of accessory mutations in most and least entrenching sequences. The number of accessory mutations among the 10% “most” and “least” entrenching sequences (right and left, respectively) for the primary mutations V82A, I84V, and L90M with a fixed Hamming distance of 10 from consensus. In all three cases, the distributions are not significantly different (Mann-Whitney , all with P > 0.05).
