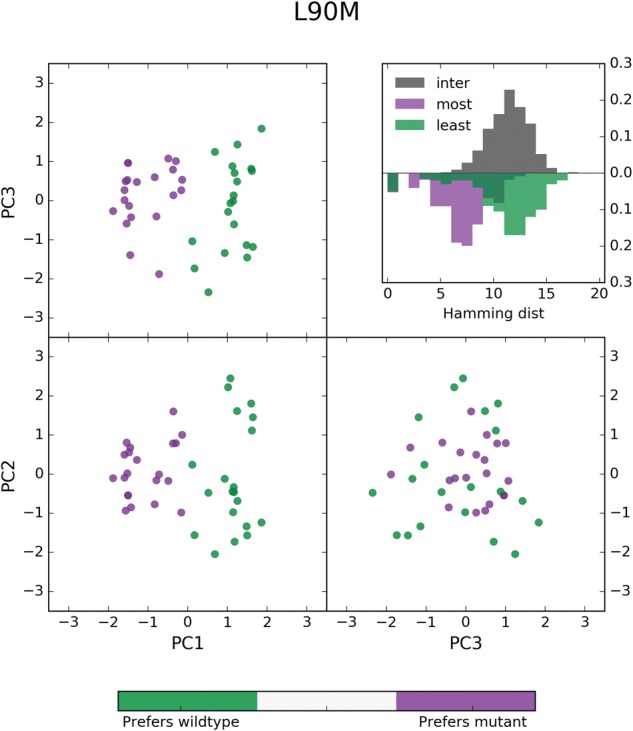
Fig. 6.

PCA analysis of most and least entrenching sequence backgrounds for primary resistance mutation L90M. Sequences from the 10th and 90th percentiles in of the sequences containing L90M and with a Hamming distance of 10 from the consensus were labeled as “least entrenching” and “most entrenching”, respectively, and pooled. These sequences of length L = 93 encoded with a Q = 4 alphabet were transformed to bit vectors of length LQ and Principal component analysis (PCA) was performed on this set of transformed sequences. The projection of these sequences onto their first three principal components are shown above with the least entrenching sequences colored green and most entrenching sequences colored purple. The first principal component clearly separates the most from the least entrenching sequence backgrounds for L90M (most: , least: ) whereas the other two components explain variation within the two groups of sequences. Shown in the inset are the distributions of hamming distances between (gray) and within the most entrenching (purple) and least entrenching (green) sequences.
