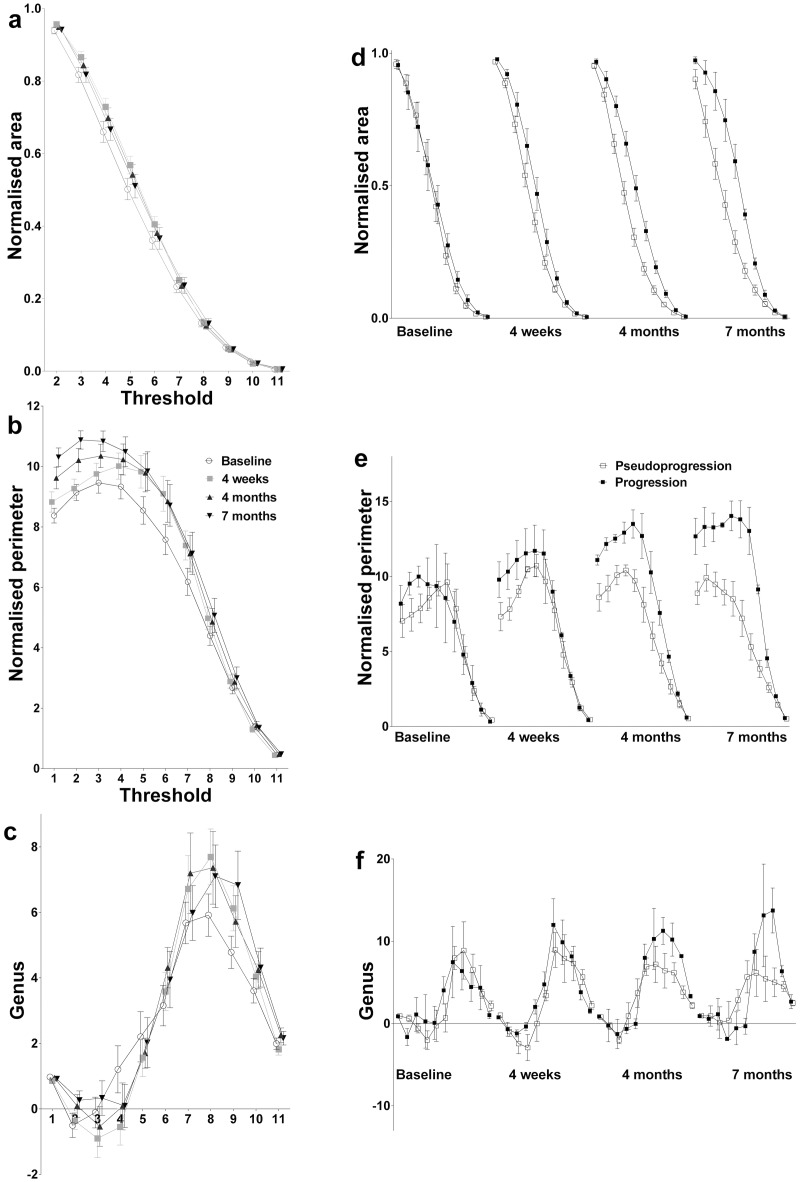
Fig 2. MFs of the retrospective patient cohort.
Spectral representations of MFs (mean ± standard error) plotted as a function of grey-scale threshold using blinded (a-c) and unblinded (d-f) data from the retrospective patient cohort. The more heterogeneous the regions of interest, the higher the normalized perimeter value; and the further the genus value is from unity.

