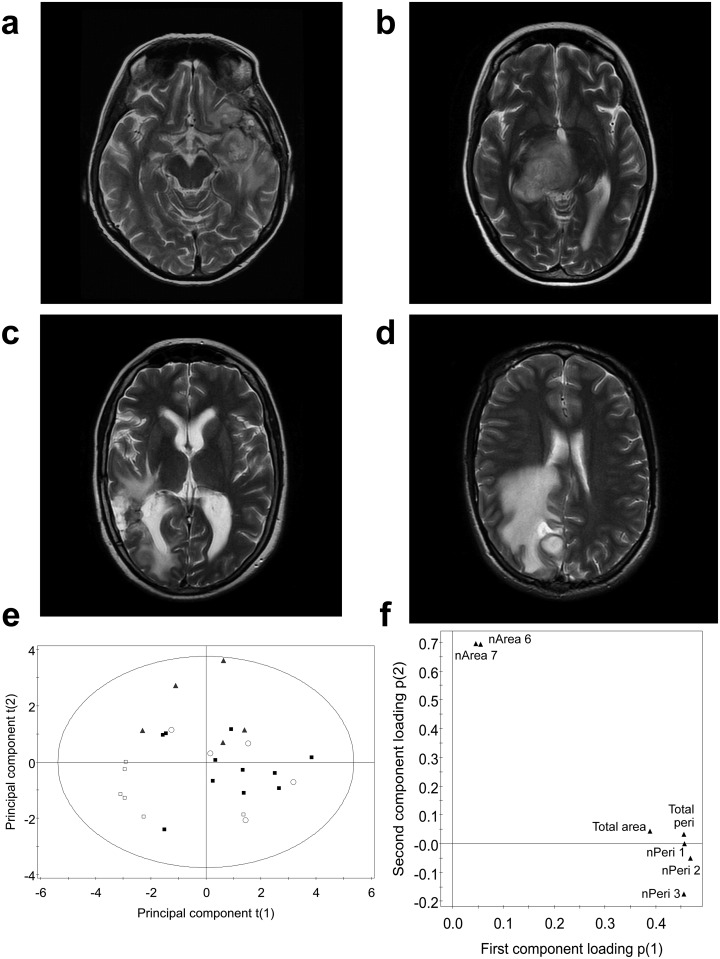
Fig 5. Model comparison with radiation necrosis and vasogenic oedema.
T2–weighted axial images showing a patient with (a) progression, (b) pseudoprogression, (c) radiation necrosis, and (d) vasogenic oedema. Principal component score plot (e) for those patients with progression (filled black squares) and pseudoprogression (empty squares) from the training dataset, using the features selected for the original SVM model. Vasogenic oedema (triangle) and radiation necrosis (empty circle) were also plotted using the same set of selected features. All features were univariate-scaled. The displayed T2 Hotelling’s tolerance ellipse is set at the 0.05 significance level. The loading plot (f) corresponding to the principal component score plot, showed that the normalized perimeter and size features were positively correlated and separated pseudoprogression from progression and radiation necrosis.

