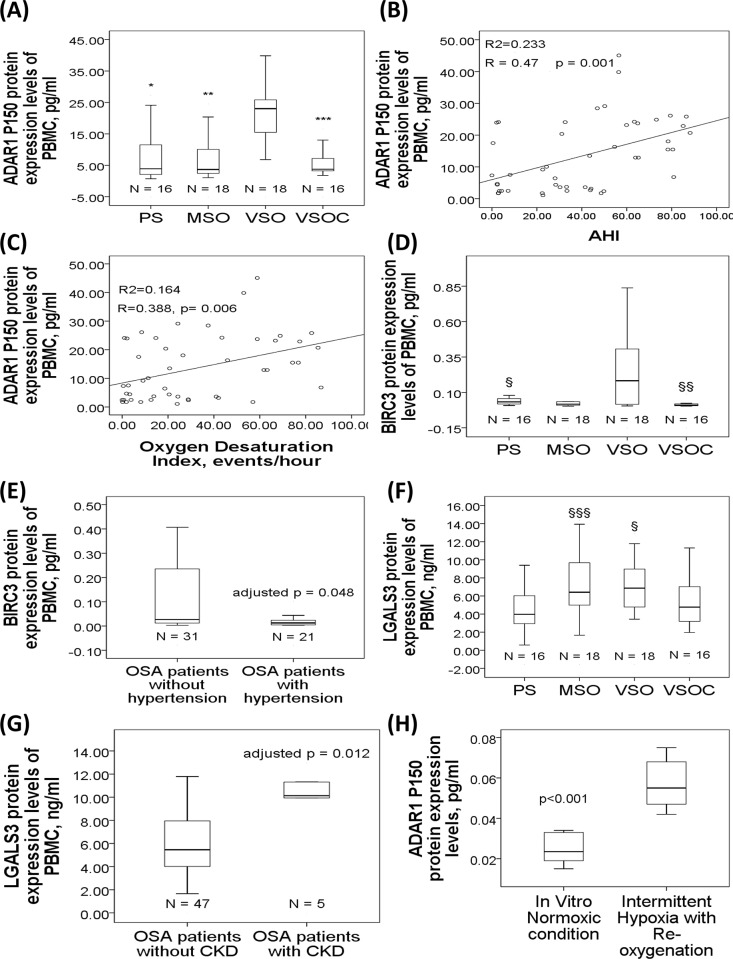
Fig 4. ADAR1 P150, BIRC3, and LGALS3 protein expression levels in the study cohort 2.
(A) ADAR1 P150 protein expression was increased in the VSO group, and decreased in the VSCO group. ADAR1 P150 protein expression was positively correlated with (B) AHI and (C) ODI. (D) BIRC3 protein expression was increased in the VSO group and decreased in the VSOC group. (E) BIRC3 protein expression was decreased in OSA patients with hypertension as compared to that in those without hypertension. (F) LGALS3 protein expression was increased in the MSO and VSO groups as compared to that in the PS group. (G) LGALS3 protein expression was increased in OSA patients with chronic kidney disease. (H) ADAR1 P150 protein expression was increased under short-term in vitro intermittent hypoxia with re-oxygenation condition. §p<0.05, compared between the VSO and PS groups. §§p<0.05, compared between the VSO and VSOC groups. §§§p<0.05, compared between the MSO and PS groups.

