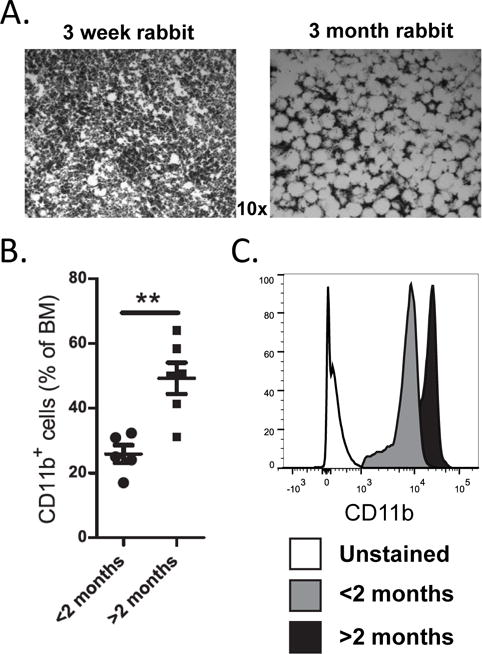
Figure 1. Comparison of fat and myeloid cells in rabbit BM before and after the decline in B lymphopoiesis.

(A) Representative H&E-stained BM sections from femurs of 3-week-old (ongoing B lymphopoiesis) and 3-month-old (arrested B lymphopoiesis) rabbits. Fat is visualized as white spaces. (B and C) BM was analyzed by flow cytometry for CD11b+ cells. (B) Percentage of CD11b+ cells in BM of <2-month-old rabbits (circles) and >2-month-old rabbits (squares) n=11. (C) Representative flow cytometric analysis of gated CD11b+ cells from a <2-month-old rabbit (ongoing B lymphopoiesis) and a >2-month-old rabbit (arrested B lymphopoiesis). Significance in (B) was determined by Student’s t test. Error bars represent the average ±SD.
