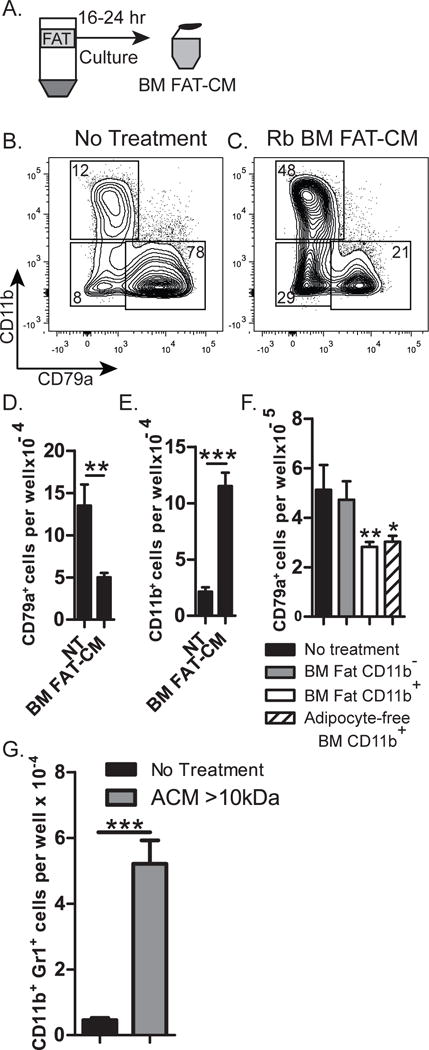
Figure 3. Inhibition of B lymphopoiesis and induction of myelopoiesis by BM fat-derived molecules.

(A) Diagram of adipocyte layer isolated from centrifuged BM of >2-month-old-rabbits, and cultured for 16–24 hr to produce BM FAT-CM, which was added to BM cultures. (B and C) Flow cytometric analysis of cells from untreated cultures (no treatment) or cultures treated with BM FAT-CM, and stained for expression of CD79a and CD11b. (D&E) Number of (D) CD79a+ or (E) CD11b+ cells from untreated cultures (NT) or cultures treated with BM FAT-CM. Data are representative of four independent experiments. Statistical significance was determined using Student’s t test. Error bars represent the average of triplicate wells ±SD. (F) Rabbit BM progenitors (10,000) were cultured on OP9 stromal cells in the presence of IL-7, SCF, and Flt3L, with 10,000 of the following effector cells from BM of >2-month-old rabbits: CD11b− or CD11b+cells from BM fat; or CD11b+ cells from the adipocyte free pellet. Statistical significance compared to untreated samples was determined by ANOVA coupled with the Dunnet multiple comparison test (p<0.0001). Data are representative of 3 independent experiments. Error bars represent the average of triplicate wells ±SD. (G) ACM >10kDa was added to cultures of mouse B220− BM cells on OP9 stromal cells, and the number of CD11b+Gr1+ cells was assessed at the end of culture. Data are representative of three independent experiments. Statistical significance was determined using Students t test. Error bars represent the average of triplicate wells ±SD.
