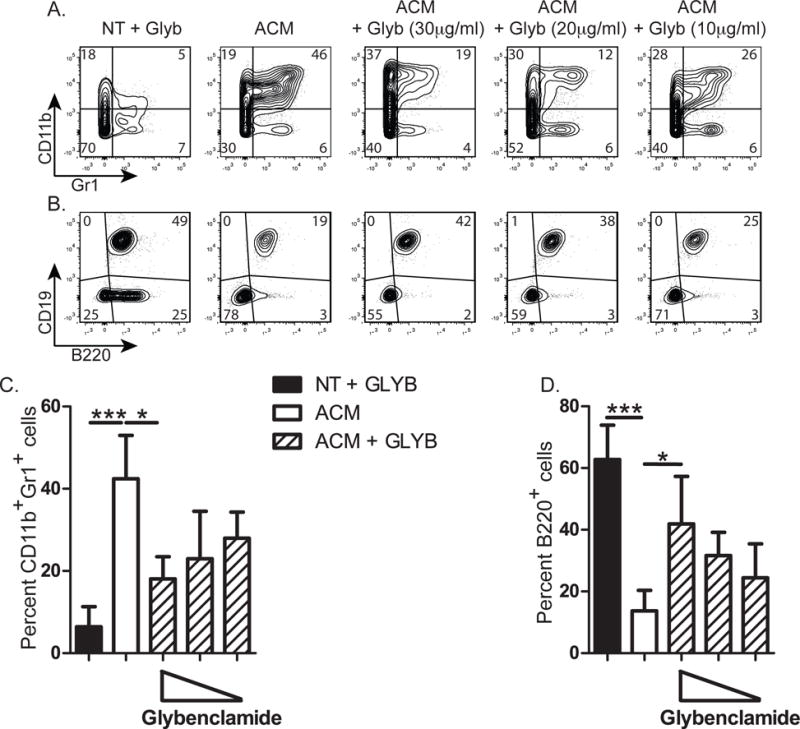
Figure 4. Effect of glybenclamide treatment on ACM induction of CD11b+ Gr1+ MDSCs and inhibition of B lymphopoiesis.

Untreated (NT) or ACM (>10kDa)-treated mouse B lymphopoiesis cultures were performed in the presence or absence of glybenclamide, and the production of CD11b+Gr1+ and B220+ cells was assessed. Representative flow cytometry profiles of cells collected at the end of culture and stained for expression of (A) CD11b and Gr1 or (B) CD19 and B220. (C and D) Percentage of (C) CD11b+Gr1+ or (D) B220+ B lineage cells resulting from the indicated treatments. Data are representative of 3 to 4 individual experiments per condition. Significance was determined by ANOVA in combination with a Bonferroni multiple comparison test (p=0.0005 and p=0.0001 for (C) and (D) respectively). Error bars represent the average ±SD.
