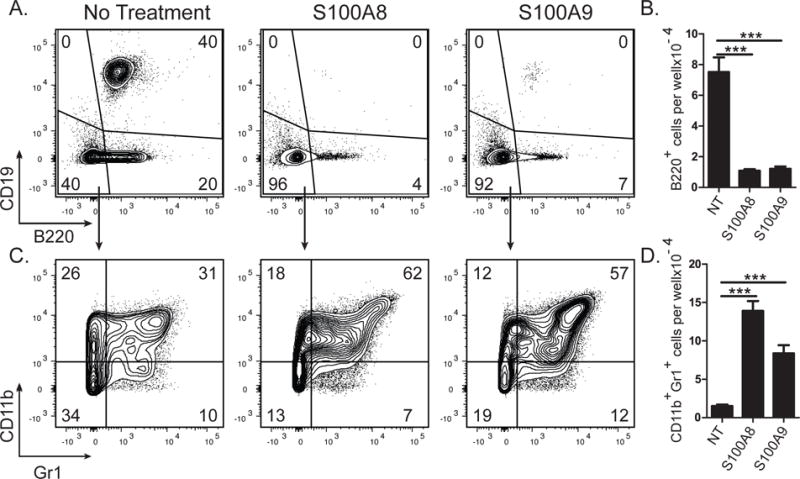
Figure 5. Inhibitory effect of S100A8 and S100A9 on B lymphopoiesis.

S100A8 or S100A9 was added to mouse B lymphopoiesis cultures. Representative flow cytometric analysis of cells collected after no treatment, S100A8, or S100A9 (5μg/ml) treatment, stained for B220 and CD19 (A) or CD11b and Gr1 (C). Number of (B) B220+ or (D) CD11b+Gr1+ cells. Data are representative of 3 independent experiments. Statistical significance in (B&D) was determined by ANOVA coupled with the Dunnet multiple comparison test (p<0.0001 and p<0.0001 respectively). Error bars represent the average of triplicate wells ±SD.
