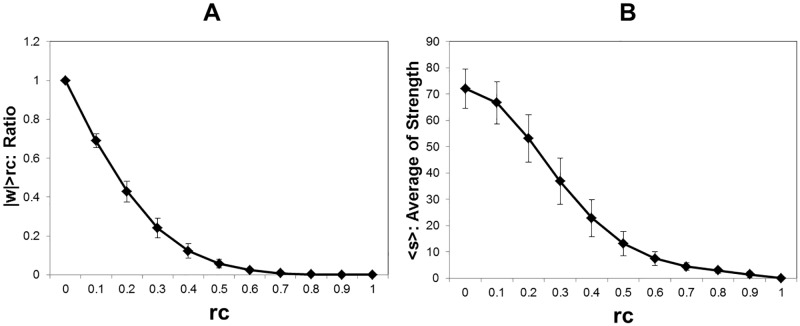
Fig 1. Connectivity weight and node strength.
A Connectivity weight. For the connectivity matrices (wij), where i and j correspond to 177 brain regions, the ratio of the number of the weights, which satisfy wij > rc for the threshold rc, are estimated for each data set. The average and the standard deviation indicated by error bars are taken for whole datasets, 986 functional connectome datasets [9, 15]. This value is equivalent to the total number of connections and proportional to the average degree. B Node strength. The node strength, the total sum of |wij| > rc for each i, is calculated for each connectivity matrix. The plot shows the average of the node strength with the standard deviation with the same datasets.

