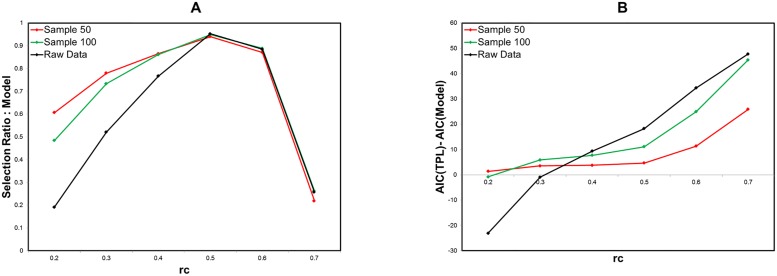
Fig 7. Model selection for sampling data of strength distribution.
A Model selection ratio. For the sampling data with the size of 50 (red lines) and 100 (green lines), we compare our model to the truncated power law and the power law with the selection ratio of our model. We extract data from the raw data according to the order of their values. These results are obtained by the fitting and evaluating method same to Fig 5. B AIC difference of truncated power law from our model. The AIC difference of the truncated power law from our model is measured for the same datasets.

