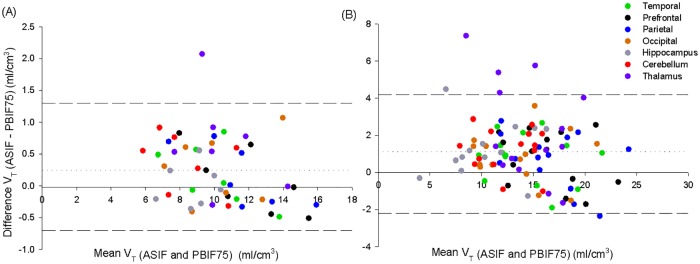
Fig 3. Bland-altman plot of VT assessed by ASIF (2-TCM) and PBIF75 (Logan plot) for 7 regions of interest in healthy controls.
FEPPA VTs derived by Logan PBIF75 plot slightly underestimated (Bias < 1 mL/cm3) those derived with 2-TCM. (A) In MABs (n = 7), the 95% limits of agreement (dashed lines) was between -0.7 to 1.3 mL/cm3 and no systematic bias was observed (r = 0.12, p = 0.6). (B) In HABs (n = 14), the 95% limits of agreement (dashed lines) was between -2.2 to 4.2 mL/cm3 and no systematic bias was observed (r = 0.08, p = 0.7).

