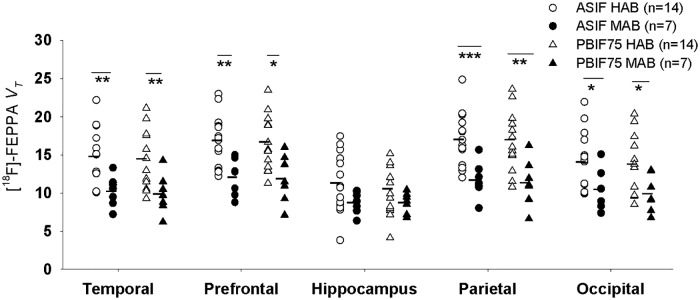
Fig 4. Total distribution volume (VT) calculated using ASIF (2-TCM) and PBIF75 (Logan plot).
In Temporal, Prefrontal, Hippocampus, Parietal and Occipital regions stratified as HAB and MAB groups. ASIF showed an average reduction of 29% in VT across ROIs while PBIF showed a reduction of 26%. 5/7 ROIs survived the multiple region Bonferroni adjustment using ASIF and only 2/7 passed the Bonferroni adjustment using PBIF75. Images were partial volume effect corrected prior to TAC extraction. * p< 0.05, ** p<0.01 *** p< 0.001.

