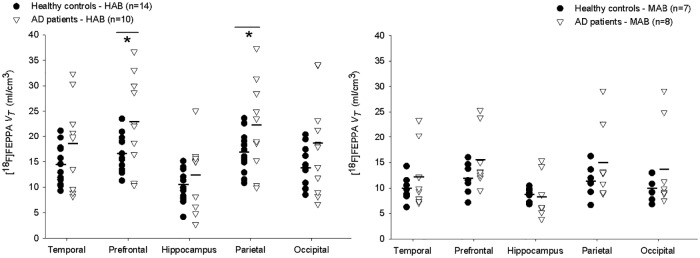
Fig 5. Comparison of [18F]FEPPA regional total distribution volume (VT) between healthy control subjects and AD patients calculated with PBIF75 for HABs (left) and MABs (right).
(cf. figure 1 in ref [7]). PBIF75 estimation led to the same conclusion as the previously published with ASIF: [18F]FEPPA VT in AD patients is on average 13–48% higher than HC (A Factorial ANOVA with genotype and age as covariate showed: p<0.05 in the Temporal, Prefrontal, Parietal and Occipital and p = 0.4 in the hippocampus). Images were partial volume effect corrected prior to TAC extraction. * p< 0.05 in ANOVA within group.

