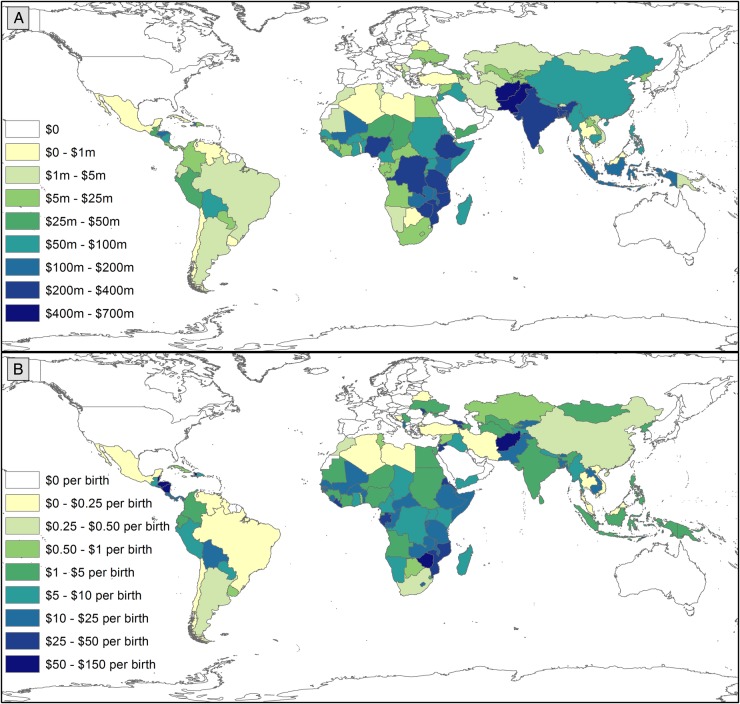
Figure 2.
Maps: Variation by recipient country in ODA+ mentioning PNH in total and per live birth, 2003–2013. (A) Presents variation in total ODA+ mentioning PNH by recipient country. (B) Presents variation in ODA+ mentioning PNH per birth by recipient country. Data are presented in constant 2013 US$ and were prepared in ArcGIS V.10.3. ODA+, official development assistance plus private grants; PNH, prenatal and neonatal health.

