Figure 1.
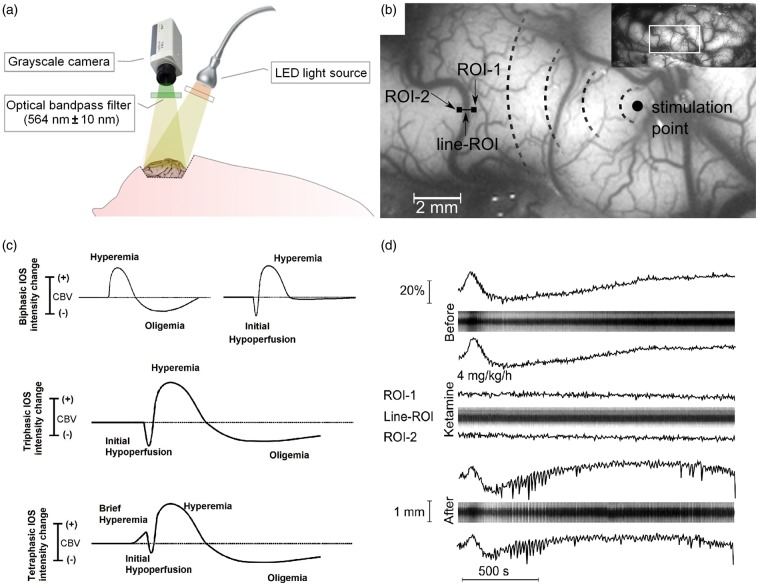
(a) Illustration of the experimental setup. (b) Anatomical surface image of a representative gyrus of the swine brain. The section shows the placing of 2 square-ROIs (ROI-1 and ROI-2) and a line-ROI perpendicular to the arterial axis. (c) Schematic shapes of a variety of haemodynamic responses observed in IOS after KCl-stimulation. (d) Representative example of parenchymal CBV and arterial diameter responses to SD. An example of intensity IOS changes from square-ROIs (ROI-1 and ROI-2) and x-t plots of line-ROIs of arterial response before, during and after 4 mg/kg/h ketamine infusion are shown. A biphasic response of hyperemia/dilation and oligemia/vasoconstriction can be observed. Note that during ketamine infusion, the haemodynamic changes are absent.

