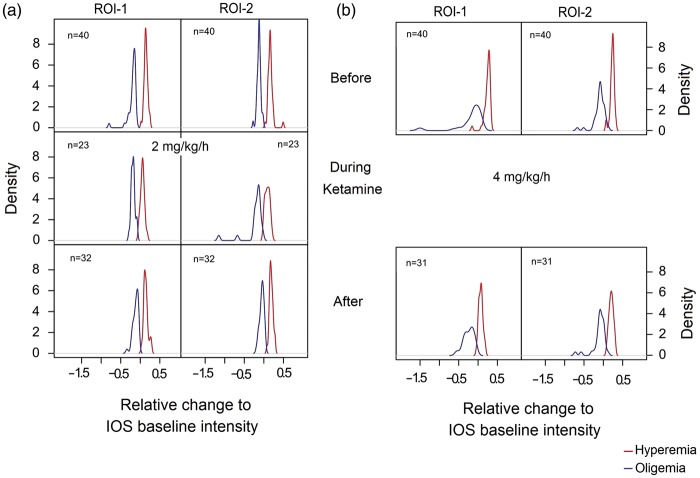
Figure 3.
Estimated density of the parenchymal CBV relative change to baseline intensity of ROI-1 and ROI-2 for both experimental groups. The density was obtained by kernel density estimation. The vertical axis represents the density, and the x-axis represents the relative change from baseline. The time scale within each SD is given by the colour: hyperemia (red) and oligemia (blue). (a) Density of ROI-1 and ROI-2 in the low-dose group. Pial arteries did not hinder SD passage between ROI-1 and ROI-2. (b) Density of ROI-1 and ROI-2 in the high-dose group is shown. Note that during the high-dose of ketamine, SDs were blocked.

