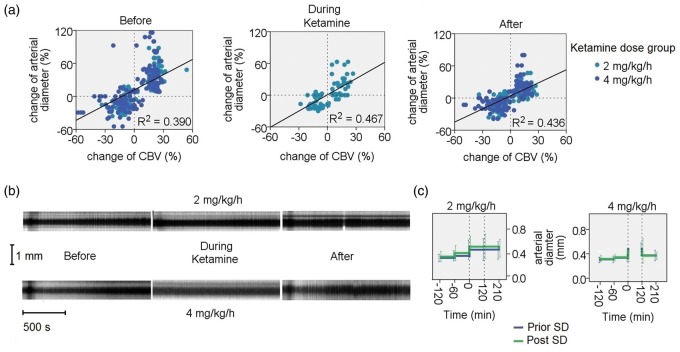
Figure 4.
Pial arterial diameter changes in response to SDs. (a) Correlation of relative pial arterial diameter changes versus CBV haemodynamic changes registered in IOS changes for the various experimental phases. Note that there is a good correlation between these for the various experimental phases (before, during and after ketamine) (Pearson correlation R = 0.624, P < 0.01; R = 0.684, P < 0.01; R = 0.661, P < 0.01, respectively). (b) Representative example of pial arterial diameter responses to SD. Examples of x-t plots of line-ROIs for the pial arterial response before, during and after 2 mg/kg/h (upper trace) and 4 mg/kg/h (lower trace) ketamine perfusion are shown. A biphasic response of vasodilation and vasoconstriction can be observed. During ketamine at the high-dose, no haemodynamic response is seen. A progressive increase in pial arterial diameter can be observed. (c) Arterial dilatory changes during the experimental phases for the various groups. The diameter (mm) before SD (blue) and the diameter after SD (green) are shown. Note the gradual increase in diameter before the ketamine period. The dotted vertical lines indicate the period during ketamine administration. After the low ketamine dose, an increase in arterial diameter can be observed. In comparison, after the high-dose, arteries presented an increased diameter with a gradual decrease.

