Figure 5.
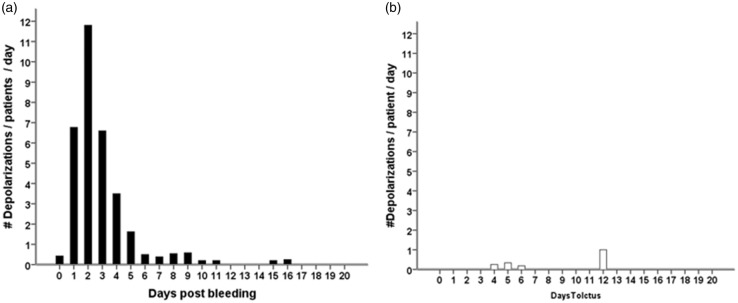
Time course of SDs following primary intracerebral hemorrhage in patients with (a, black bars, N = 22) and without perihematomal edema progression (b, white bars, N = 4). All patients, including those without depolarizations, were included in the analysis. The total number of depolarizations by day was divided by the number of patients recorded in the corresponding time interval in order to obtain mean rates that can be compared across time. SD: spreading depolarization.

