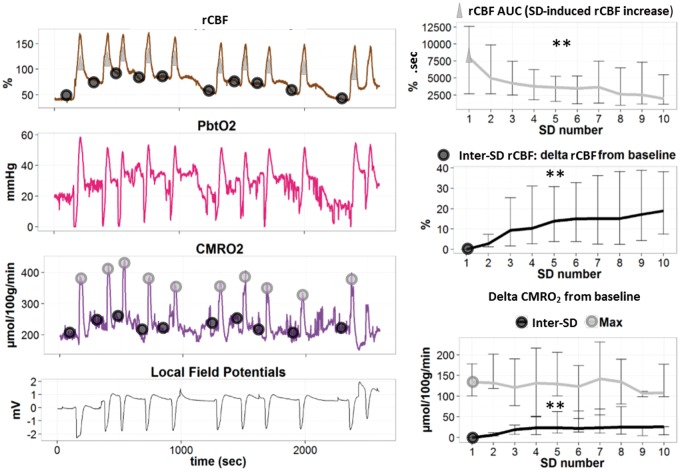
Figure 4.
Changes of rCBF and metabolic variables during clusters of SDs in the injured brain. Left panel: regional cerebral blood flow (rCBF in %), brain tissue partial pressure of oxygen (PbtO2 in mmHg), cerebral metabolic rate of oxygen (CMRO2 in µmol/100 g/min), and local field potentials (LFPot in mV), during a cluster of SDs (original traces). Black circles describe the points for calculations of baseline and inter-SD values of rCBF and CMRO2. Gray triangles and circles, respectively, describe the points for the calculations of the area under the curve (AUC) (rCBF increase) and the maximum (Max) of CMRO2. Right panel: rCBF AUC and inter-SD rCBF (median and IQR, n = 12) are presented as percentage change from baseline (precluster). Note that rCBF AUC decreased while the inter-SD rCBF level increased during the cluster. In the right lower panel, maximum (Max) and inter-SD CMRO2 (Median and IQR, n = 6) relative to baseline show a constant peak with a gradual increase of inter-SD CMRO2 during the cluster. ** p ≤ 0.01: effect of “SD number” factor in a repeated measures ANOVA.

