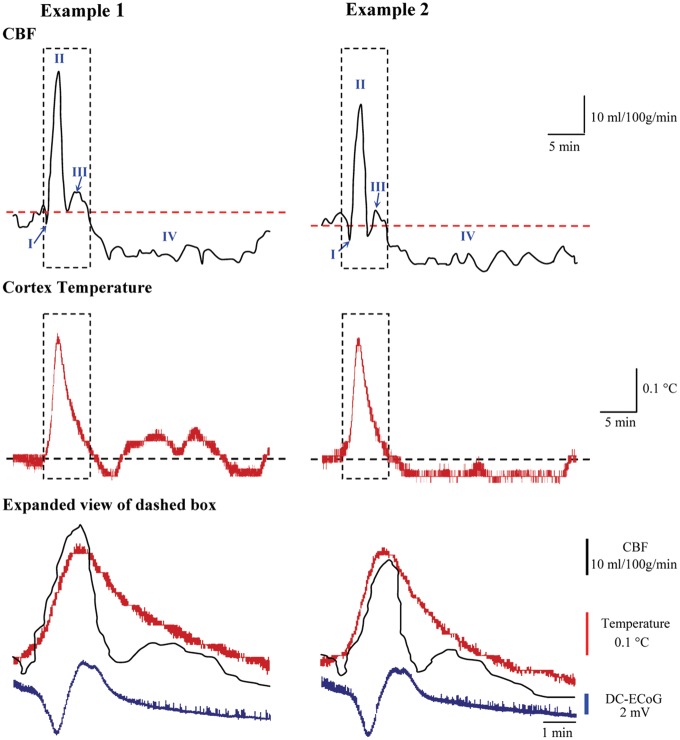
Figure 2.
Temperature and regional cerebral blood flow responses to spreading depolarizations. Two examples of cortical temperature and rCBF responses to SD recorded simultaneously from the same sensor. Blue arrows in rCBF traces indicate the initial shallow hypoperfusion (Phase I); subsequent phases are labeled II–IV. Expanded view of dashed box compares the time course of temperature and rCBF with the DC shift of SD.
DC-ECoG: direct-current electrocorticography; CBF: cerebral blood flow.

