Figure 6.
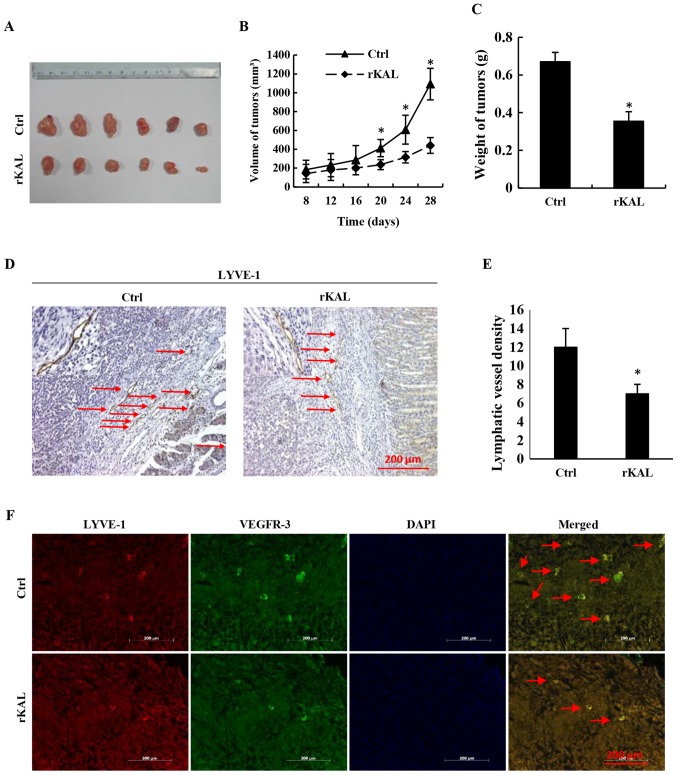
The lymphatic vessel density (LVD) in gastric cancer xenografts of nude mice. (A) Xenografts from nude mice. n=6, PBS group and rKAL group. (B) Volume of gastric tumors from each group. (C) Weight of gastric tumors from each group. (D) Lymphatics in the gastric tumors from each group stained with LYVE-1. (E) Histogram representing the LVD in the gastric tumors. (n=6). (F) Double staining of lymphatic tubes with VEGFR-3 and LYVE-1. Scale bar, 200 µm. *P<0.05, **P<0.01, the results are presented as the mean ± standard deviation.

