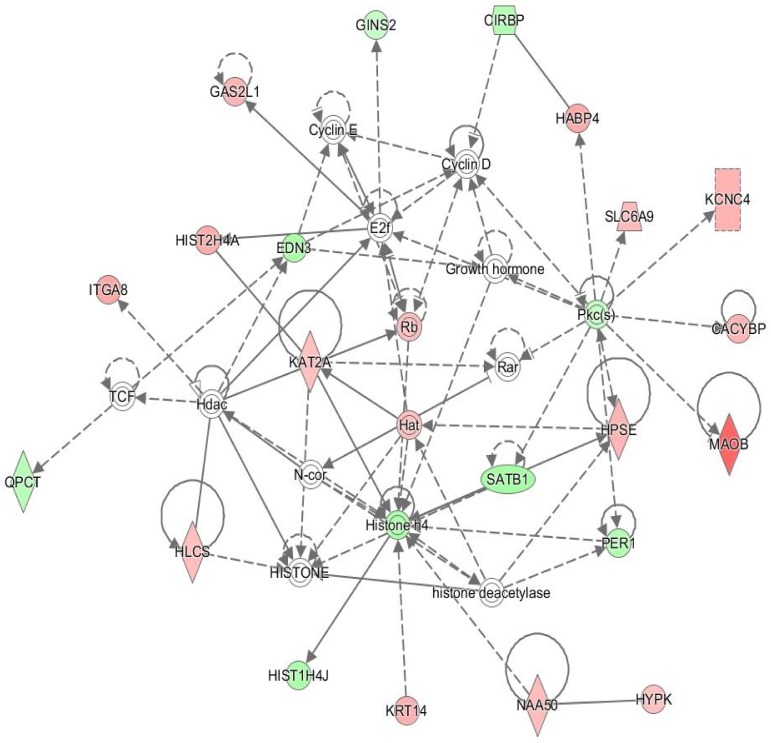
Fig 3. Metabolism and cellular assembly/organisation network in rumen papillae following re-alimentation induced compensatory growth (Network 6: Carbohydrate metabolism, small molecule biochemistry and cellular assembly and organisation).
The network is displayed graphically as nodes (genes). The node colour intensity indicates the expression of genes; with red representing up-regulation and green, down-regulation in animals following a period of re-alimentation induced compensatory growth relative to following a period of dietary restriction.

