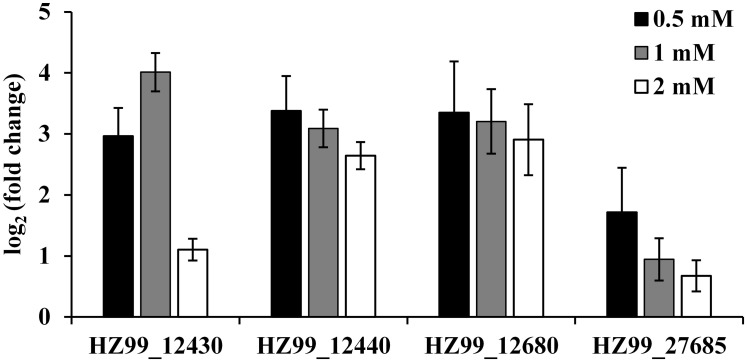
Fig 3. Expression analysis of DGEs after treatments with different concentrations of EGCG in P. fluorescens.
White, gray and white bars represent 0.5, 1 and 2 mM EGCG treatment, respectively. The Y-axis shows values of log2 (fold change) observed for EGCG-treated samples vs controls. Three biological replicates were performed for qRT-PCR. Error bars represent standard deviation.

