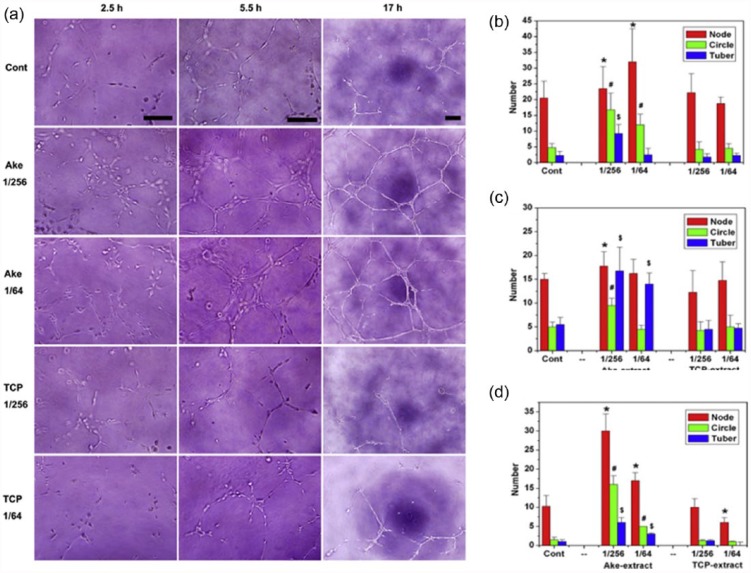
Figure 3.
In vitro angiogenesis of HAECs cultured on ECMatrix in the presence of Ake and TCP extracts at 1/256 and 1/64 dilutions. (a) Optical images of HAECs cultured on ECMatrix in the presence of Ake and TCP extracts at 1/256 and 1/64 dilutions for 2.5 h (bar = 100 µm), 5.5 h (bar = 100 µm), and 17 h (bar = 200 µm). (b–d) The statistics of the number of nodes, circles, and tubes formed in the culture after 2.5, 5.5, and 17 h, respectively. Data represent mean values ± SD (n = 4). The symbols /, #, and $ represent p < 0.05 of node number, p < 0.01 of circle number, and p < 0.01 of tube-like number, respectively, when compared with the control. Reprint permission was obtained from Zhai et al.12

