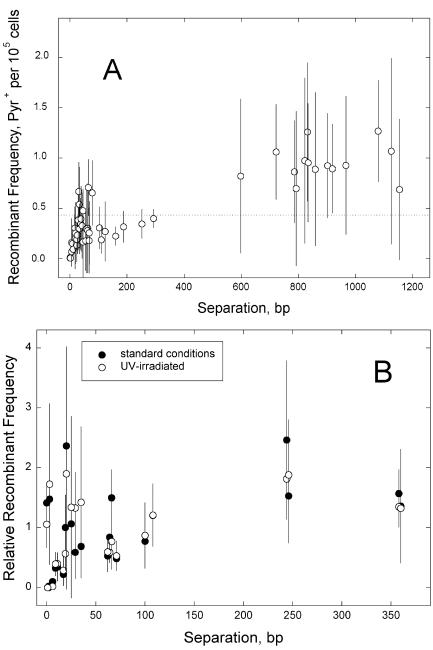
FIG. 1.
Recombination frequency in ME as a function of the distance between markers. A. Marker separations of 0 to 1,154 bp. Frequencies are numbers of Pyr+ recombinants per cell plated, representing median values from four to seven independent determinations (the horizontal line marks the average of all medians); error bars indicate standard deviations. B. Effect of DNA damage. Washed cell suspensions were divided in half, and one half received 50 J/m2 of UV-C radiation before the mating. Mean numbers of recombinants per CFU and standard deviations (error bars) were normalized to the average of all values for each treatment. Solid symbols, untreated; open symbols, UV irradiated.

