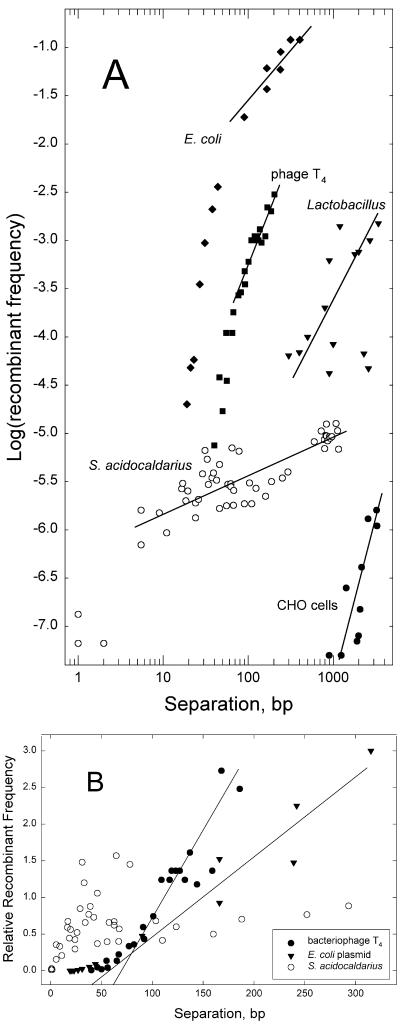
FIG. 2.
Comparison of S. acidocaldarius ME to other systems. A. Logarithmic plot. Straight lines approximate linear regressions of the surrounding points, with the following slopes: E. coli plasmid recombining with bacteriophage λ (25), 1.0; bacteriophage T4 mutants (26), 2.0; plasmid integration into L. sake chromosome (15), 2.2; linearDNA integrating into Chinese hamster ovary cell APRT gene (23), 3.5; S. acidocaldarius conjugational crosses (data of Fig. 1A), 0.5. B. Arithmetic plot. To facilitate comparison, the recombinant frequencies for each system were normalized to the average value over the interval shown. Data are corresponding subsets of those in Fig. 1A. Lines approximate linear extrapolation of higher frequencies to zero recombination.

